Viewing Active Alarms
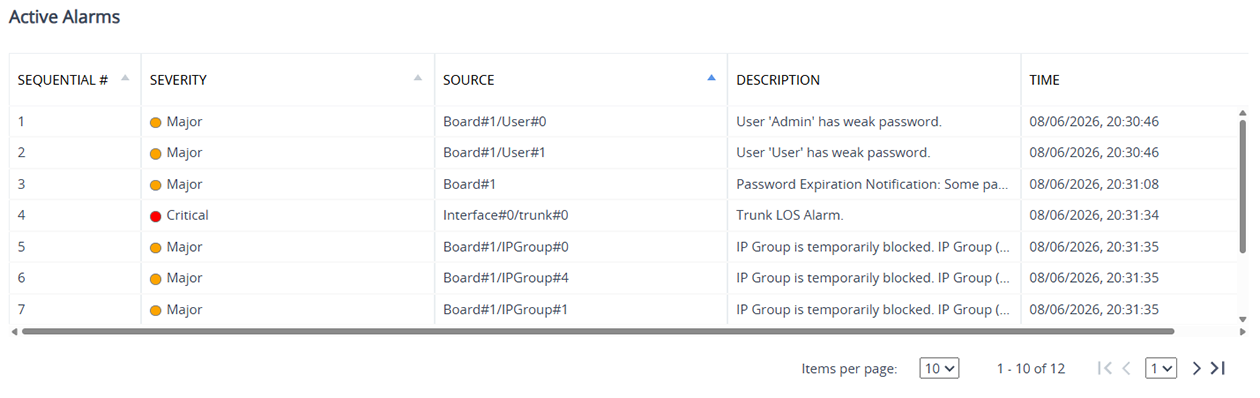
You can view currently active alarms that have been raised by the device. These are displayed in the Active Alarms table.
The alarms are displayed from latest to oldest, whereby the most recently raised alarm is listed first in the table. The table is automatically refreshed every 60 seconds.
To configure the maximum number of alarms that can be displayed in the table, use the [ActiveAlarmTableMaxSize] parameter. If the maximum is reached and a new alarm is added to the table, the oldest alarm is removed from the table to accommodate the new alarm.
| ● | The device deletes all the alarms in the Active Alarms table upon a device restart. |
| ● | The alarm bell icon, located on the top-right of the Web interface's window, displays the number of currently active alarms raised by the device and the highest severity (color coded - see below) of these alarms. |
| ● | For a description of the SNMP alarms, refer to the device's SNMP Alarm Reference Guide. |
The following procedure describes how to view the Active Alarms table through the Web interface. You can also view it through or CLI (show system alarms).
| ➢ | To view active alarms: |
| 1. | Open the Active Alarms table: |
| ● | Navigation tree: Monitor menu > Monitor tab > Summary folder > Active Alarms |
| ● | Alarm bell icon  located near the top-right corner of the Web interface. located near the top-right corner of the Web interface. |
The following figure shows an example of the Active Alarms table:
| 2. | Use the pagination controls located below the table to do the following: |
| ● | Configure the maximum number of alarms (rows) displayed per page (10, 20, or 50). |
| ● | Jump to the next or previous page. |
| ● | Jump to the first or last page. |
The following table describes the columns of the Active Alarms table:
Active Alarms Table Description
|
Field |
Description |
|||||||||
|---|---|---|---|---|---|---|---|---|---|---|
|
Sequential # |
Displays the number of the alarm. Alarms are numbered sequentially as they are raised by the device. The numbering resets to 1 after a device restart (i.e., first alarm raised after a restart is assigned #1). |
|||||||||
|
Severity |
Displays the severity level of the alarm:
|
|||||||||
|
Source |
Displays the component of the device for which the alarm was raised. |
|||||||||
|
Description |
Displays a description of the alarm. |
|||||||||
|
Time |
Displays the date (DD/MM/YYYY) and time (HH:MM:SS) that the alarm was raised. Note: The date and time of the alarm is based on the device's local date and time. |
|||||||||
|
Type |
Indicates if the alarm is an SNMP trap alarm ("Alarm") or event ("Event"). |


